DVB Inspector
Digitalekabeltelevisie.nl
User manual
Grid view
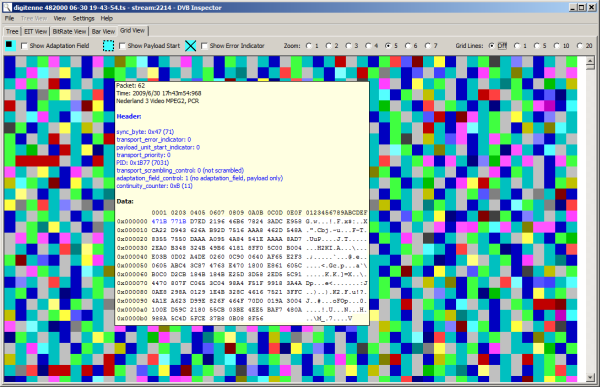
The grid view shows individual
packets of the transport stream, using the same colors as the
bitrate chart. When the mouse is placed over a box, the mouse over
shows details of that packet.
Show adaptation Field

![]() When the check box "Show Adaptation
Field" is selected all packets for which an adaptation field is
present are shown like this.
When the check box "Show Adaptation
Field" is selected all packets for which an adaptation field is
present are shown like this.
![]() When the check box "Show Payload
Start" is selected all packets for which payload start flag is set
are shown like this.
When the check box "Show Payload
Start" is selected all packets for which payload start flag is set
are shown like this.
![]() When the check box "Show Error
Indicator" is selected all packets for which the
transport_error_indicator flag is set are shown like this.
When the check box "Show Error
Indicator" is selected all packets for which the
transport_error_indicator flag is set are shown like this.
Zoom
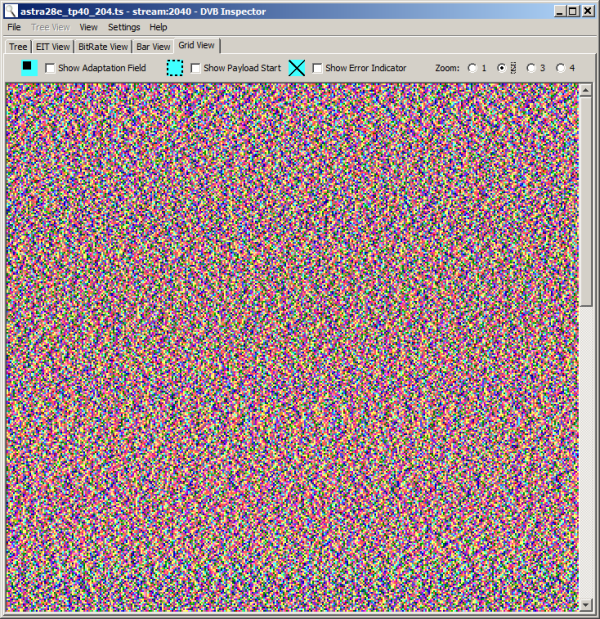
With the Zoom
radio buttons the size of the 'packet boxes' can be changed. When
it is small it is easy to get a overview how distributed the PIDs
are.
Lines
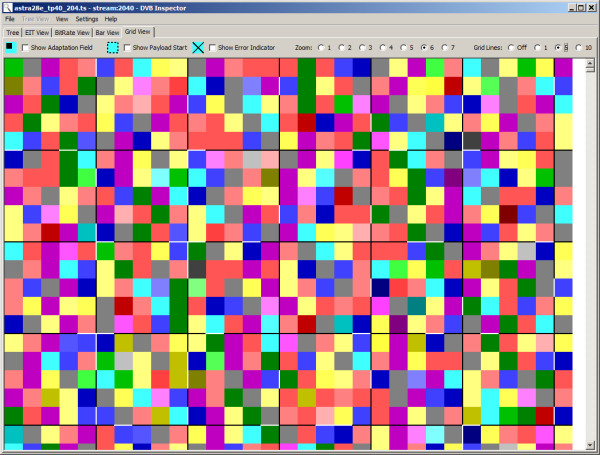
With the Grid
Lines radio buttons lines can be drawn across the grid. This can
help in counting distance between packets, specially when there
are multiple packets with the same PID (hence same color).
Structure
For most transport streams the picture will show very little structure, but for example a DVB-H stream will clearly show the time slicing.
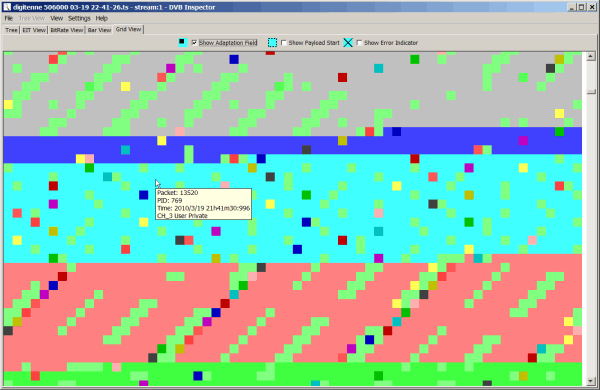
This is
part of the DVB-H service. The time slices are easy to see.
Grid Filter
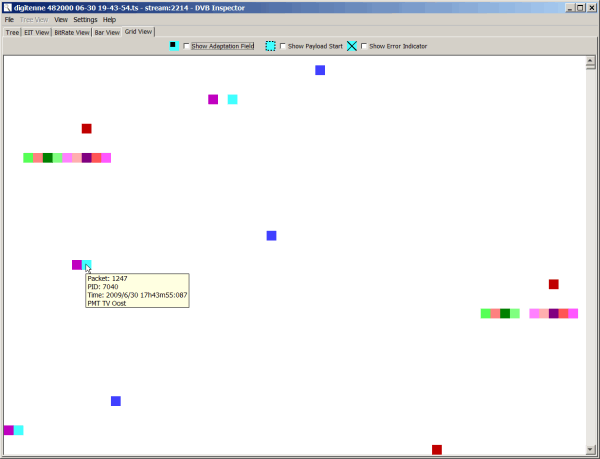
When we filter the example stream to show
only the PMT fields, we see these are closely grouped together at
almost constant distances.
This graph also uses the selected range from the filter, so you can analyze a selected part of the file.
This page was last modified on 4/08/2024